

Industrial datasets rarely arrive in a neat, analysis-ready format. In manufacturing, logistics, energy, or plant operations, data often comes from multiple sources such as PLC logs, IoT sensors, ERP exports, and manual operator entries. These sources produce “dirty” data: inconsistent timestamps, missing values, duplicated rows, unit mismatches, and messy categorical labels. If you start modelling or building dashboards before cleaning, you risk misleading insights and poor decisions.
Pandas is one of the most practical tools for handling these issues because it supports fast exploration, repeatable transformations, and robust quality checks. For learners in a data science course in Chennai, advanced data wrangling is a high-value skill because it is used daily across real projects. This article explains how to build reliable cleaning pipelines in Pandas, with patterns you can apply to industrial datasets.
Understanding Common “Dirty Data” Patterns in Industry
Before writing transformations, you need to recognise typical failure points:
Inconsistent schema and naming
Industrial exports often have unpredictable column names like “Temp”, “TEMP_C”, “temperature”, or “T1”. Some columns may shift order or appear only in certain files.
Mixed data types
A column that should be numeric may contain strings like “NA”, “-”, “error”, or “12,450” (comma-separated). Sensor streams may store numbers as text, causing aggregation and modelling errors.
Time issues
Timestamps may be stored in different formats, time zones, or even as separate date and time columns. Machine data can also have irregular sampling intervals.
Duplicates and rework entries
Reprocessing events create repeated rows. You may also see duplicate records caused by retries in data ingestion.
Learning to handle these patterns is exactly what turns basic Pandas usage into professional data wrangling, and it is a core expectation in many roles after completing a data science course in Chennai.
Building a Repeatable Cleaning Pipeline in Pandas
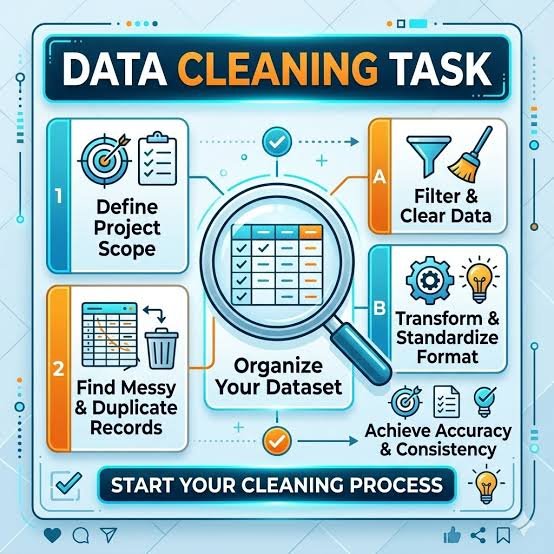
One-off cleaning in notebooks is not enough for industrial analytics. You need repeatable steps that can run daily or weekly with minimal changes. A practical approach is to structure cleaning as a pipeline with clear stages.
Stage 1: Standardise columns and formats
Start by normalising column names and ensuring consistent schemas. Convert names to lowercase, remove extra spaces, and apply mapping rules. Then enforce types using controlled conversions. For example, use pd.to_numeric(…, errors=”coerce”) to convert values and mark invalid entries as missing. This keeps your dataset consistent without silently failing.
Stage 2: Handle missing data with context
Missing values in industry are not always random. A missing vibration reading might indicate sensor downtime, while a missing operator code might be a process compliance issue. Instead of filling everything with the mean, decide per column:
- Use forward fill for continuous sensor streams when gaps are small.
- Use median or model-based imputation for stable numeric measures.
- Use “Unknown” categories for labels, but track the proportion of unknowns.
Stage 3: Remove duplicates and resolve conflicts
Duplicates should not always be dropped blindly. If duplicates differ slightly, you need rules: keep the latest timestamp, keep the record with fewer missing fields, or aggregate duplicate events by mean/sum depending on the domain. Pandas makes it easy to compare duplicated rows, then decide resolution logic.
Stage 4: Validate and log quality checks
Industrial pipelines should include checks after transformations. Examples:
- Range checks (pressure cannot be negative).
- Allowed categories (shift must be A/B/C).
- Timestamp monotonicity for time-series segments.
- Outlier flags for abnormal spikes.
These checks help catch upstream issues early and prevent bad data from reaching dashboards or models.
Implementing Complex Transformations for Industrial Use Cases
Advanced wrangling is not only about cleaning, but also about creating analysis-ready structure.
Feature-ready transformations
Industrial analytics often needs rolling metrics and grouped summaries. Pandas supports:
- Rolling windows for moving averages and trend smoothing.
- Group-based transformations for shift-level performance.
- Resampling for time-series alignment (per minute, per hour).
Handling unit and scale mismatches
A common industrial issue is mixed units: temperature in Celsius vs Fahrenheit, distance in metres vs millimetres, or weight in kg vs grams. Add explicit unit conversion steps early in the pipeline and store metadata about units so future users do not guess.
Data merging across systems
Joining machine logs with ERP batches or quality reports often causes mismatches due to inconsistent keys. You may need fuzzy joins based on time windows, batch ranges, or partial identifiers. Pandas supports merging, but the key is to design stable join rules and verify match rates so you do not lose critical records.
If you practise these transformations consistently, the transition from learning to real project delivery becomes smoother, which is why a data science course in Chennai that emphasises real datasets provides strong job readiness.
Conclusion
Advanced data wrangling is where most industrial analytics effort goes, and it is the foundation for trustworthy insights. With Pandas, you can build repeatable pipelines that standardise schema, fix types, handle missing values thoughtfully, resolve duplicates, and validate data quality. Beyond cleaning, Pandas also supports complex transformations such as rolling metrics, resampling, and structured merges across industrial systems.
If your goal is to work on real-world datasets with operational complexity, mastering these patterns is essential. A well-designed pipeline not only cleans data, it protects downstream analysis and makes models and dashboards dependable. For learners building practical capability through a data science course in Chennai, these techniques provide a strong advantage because they reflect what industry projects actually demand.